


As a Windows Active Directory Administrator, we have to do network trace to monitor the network traffic of the Windows server for troubleshooting the issues, usually, third-party applications like Wireshark been used to capture and analyze, how can we collect the network trace using Windows built-in tools without Wireshark?
There is an easy way to capturing packets using Windows native tool netsh, and this will work in Windows server operating systems like Windows Server 2016/2019 and also Client OS like Windows 10
Also Read: Active directory Troubleshooting (Part1 – Diagnostics Logging)
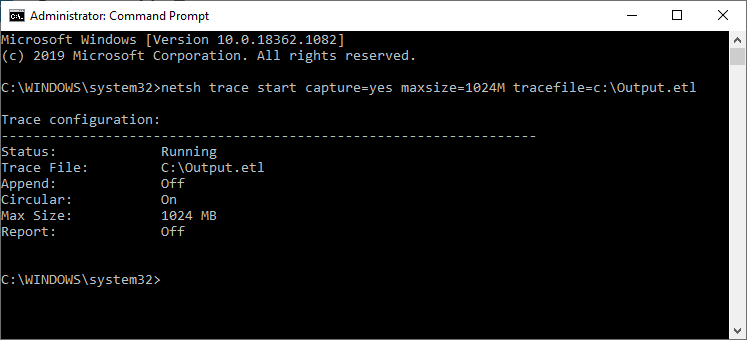
How to Run the Netsh Trace to collect the logs:
- Open CMD prompt as an Administrator
- And RUN below Command
- netsh trace start capture=yes maxsize=1024M tracefile=c:\Output.etl
- If you want to continues run even the system reboots then use the below command with a persistent switch
- netsh trace start capture=yes maxsize=1024M persistent=yes tracefile=c:\Output.etl
You can change the log file location and file name, also the file size
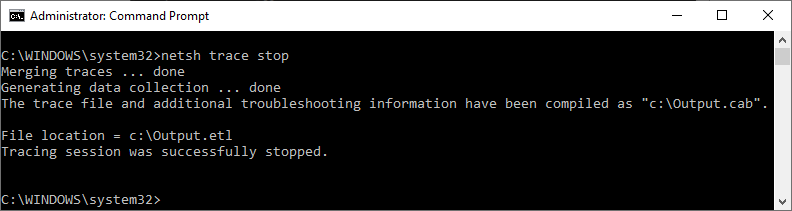
How to Stop the Netsh Trace to collect the logs:
- Open CMD prompt as an Administrator
- And RUN below Command
- netsh trace stop
- This might take some time to generate the report
Output file .etl can be open through Microsoft Message Analyzer and Microsoft Network Monitor 3.4 tools for the analysis
Also Read: Troubleshooting Tips for Windows 10 Slowness Problems
Microsoft Network Monitor 3.4 is not showing all the packets once Filter applied:
While analyzing the trace output file .etl, you won’t able to see all the captured logs due to the parser profile
How to fix Microsoft Network Monitor issue to see all the logs after filtered
- Open Microsoft Network Monitor 3.4
- Select “parser profile” on the right side of the console
- Select “parser profile Options” from the drop-down list
- Select “Windows” on General tap
- And Select “Set As Active”
- Click “OK”
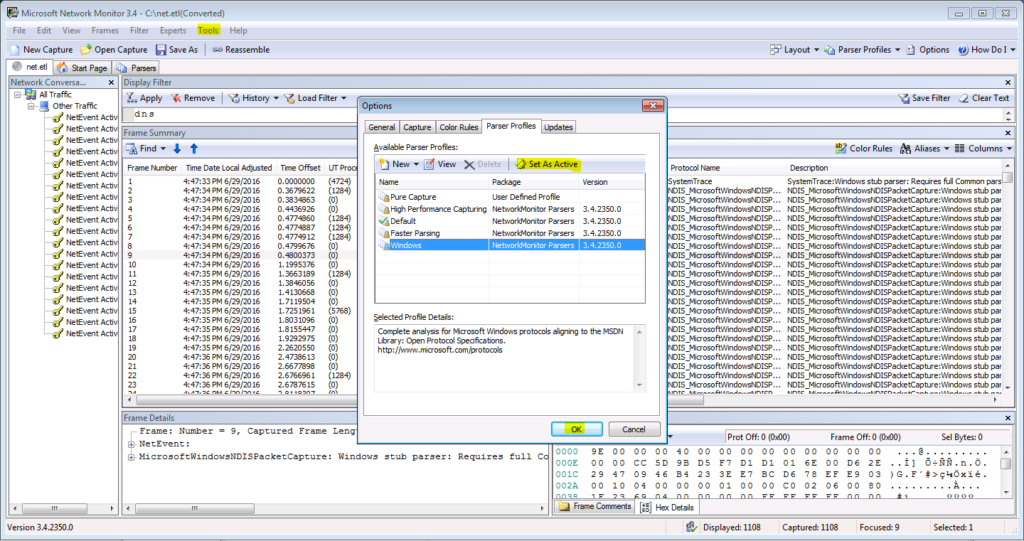
Now you will see all the captured logs
Also Read: AD Slow Authentication and prompting for credentials again and again
You can also use the scenario switch for different requirements, below command list all the available scenario, this will capture only the required traffic to reduce the file space and system load
netsh trace show scenarios
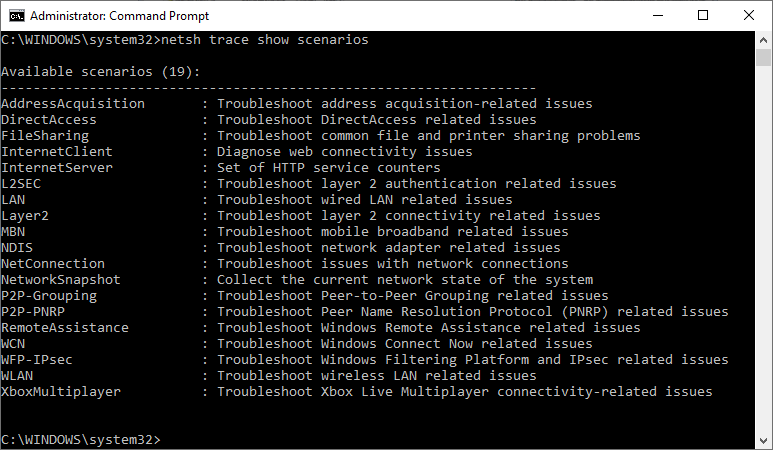
netsh trace start scenario=wlan capture=yes maxsize=1024M tracefile=c:\Output.etl
Hope this helped you to understand the netsh trace and how this can be used for troubleshooting the Windows and network issues
Also See: Active Directory real time issues and solutions
Also Read: Windows Server 2019 Features
Related posts:
 GPO Update failed with LDAP Bind function call failed error on Windows Server 2016/2019/2012 and Windows 10
 Microsoft August 2020 Patch issues and unanswered questions: No Netlogon events in Domain Controller logs after August 2020 Patches
 How to copy a full user profile to another user in Windows 10 – After profile corrupt
Windows Server 2019 Features
How to copy a full user profile to another user in Windows 10 – After profile corrupt
Windows Server 2019 Features
 How to Connect Your Android Phone to Windows 10

